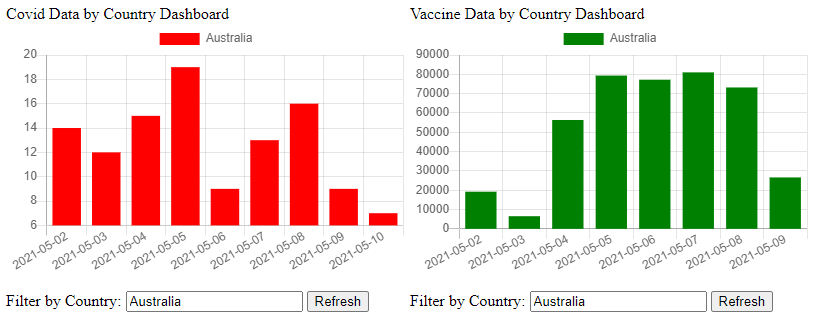
Visualization
Visualization leverages APIs using Django rest framework and JSON responses for generating the charts, current trend view for both Covid and Vaccine data.
queryset_covid = CovidData.objects.all().order_by("country")
for covid_entry in queryset_covid:
    country.append(covid_entry.country)
    labels.append(covid_entry.date)
    data_covid.append(covid_entry.confirmed)
    queryset_vaccine = VaccineData.objects.filter(
        country=covid_entry.country, date=covid_entry.date
    ).order_by("country")
    if queryset_vaccine.exists():
        for vaccine_entry in queryset_vaccine:
            data_vaccine.append(vaccine_entry.doses_administered)
    else:
        data_vaccine.append(0)

return JsonResponse(
    data={
        "country": country,
        "labels": labels,
        "data_covid": data_covid,
        "data_vaccine": data_vaccine,
    }
)
The data is visualized using Django app and chart JS